Table of Contents
- Chapter 0: How to Read This Manual
- Chapter 1: Concept & Logic (What is TENKYO?)
- Chapter 2: Quick Start (Step-by-Step Setup)
- Chapter 3: Interface Guide
- Chapter 4: Parameter Settings Explained
- Chapter 5: Understanding “Secure Logic”
- Chapter 6: Dashboard Metrics
- Chapter 6.5: Alert Configuration
- Chapter 7: Currency Pair Characteristics
- Chapter 8: FAQ
Chapter 0: How to Read This Manual
Thank you for choosing Bollinger Band Walker TENKYO. This manual details the operation and logic of the tool.
Unlike standard indicators that simply show “Buy” or “Sell” arrows, TENKYO is a trading system that assists with trend following and risk management. Please read Chapter 1 and 2 carefully to understand the core philosophy.
Chapter 1: Concept & Logic
The Logic: Capturing the “Band Walk”
The Bollinger Band “Walk” (where price rides along the ±2σ line) is one of the most profitable phases in FX. However, it is difficult to distinguish from a false breakout.
TENKYO focuses on the “Initial Velocity” of the breakout. Instead of guessing the top or bottom, we enter only when momentum is statistically confirmed. Furthermore, our unique Secure Logic prioritizes “Not Losing” over “Gambling for Big Wins.”
Core Philosophy: Capital Preservation
This tool is designed to escape from the market quickly if the trend does not develop. You may experience small wins or break-even exits frequently. This is intentional. By cutting risk early, we protect your capital until the “Big Wave” arrives.
Chapter 2: Quick Start (Setup Guide)
Please follow these steps to set up your chart correctly.
Step 1: Timeframe Selection
Set your TradingView chart to 15 Minutes.
Note: While the logic can technically run on 5m or 1h, the internal parameters are optimized for the noise/trend ratio of the 15m timeframe.
Step 2: Adding the Indicator
- Click “Indicators” at the top of the chart.
- Search for “Bollinger Band Walker TENKYO” in your Invite-Only scripts.
- Add it to the chart.
Step 3: Loading Recommended Settings
Open the TENKYO settings .
- Apply Recommended Settings: Make sure this is CHECKED (ON).
When this is ON, the tool automatically loads the best parameters (Volatility threshold, Stop-loss width, etc.) for the current currency pair. You do not need to adjust numbers manually.
Step 4: Verification
Check the dashboard in the top left corner. If it displays “Status: Active” and calculation numbers, the setup is complete.
Chapter 3: Interface Guide
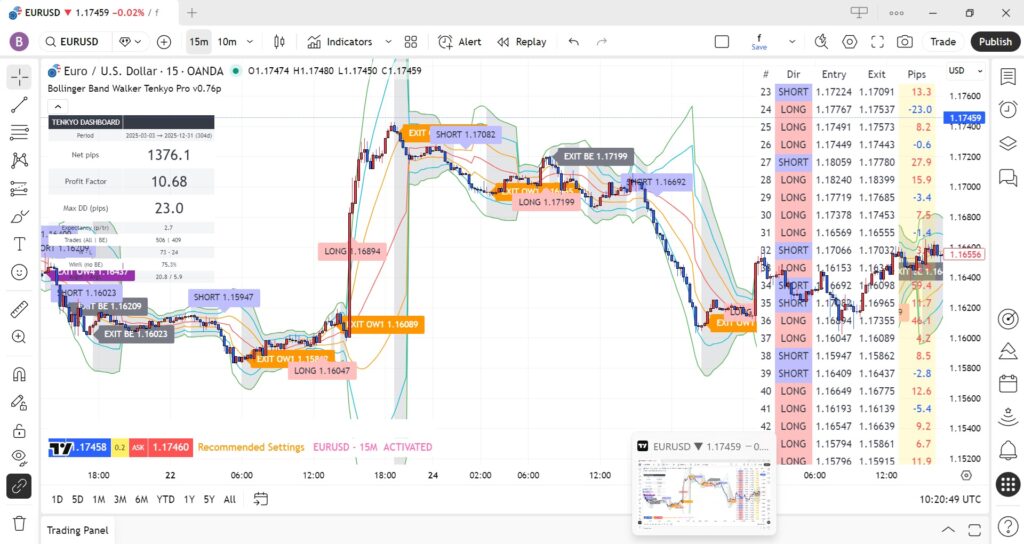
3-1 The Bands
It differs slightly from standard Bollinger Bands. TENKYO renders somewhat irregular bands based on its own unique, optimized parameters. The area between the bands is shaded gray. This is the “Range Zone”. We generally avoid initiating trades while the price is stuck in this zone.
3-2 Signals
- LONG / SHORT Label: This marks the confirmed entry point. It appears at the close of a candle that successfully breaks out with momentum.
- EXPANDING: Notifies you that the Bollinger Bands are beginning to expand and you should prepare for an entry.
Chapter 4: Settings Reference (Inputs)
This reference list details all parameters found in the indicator settings. Specific values may be updated by the developer; please refer to the actual indicator panel for the latest defaults.
| 1. RECOMMENDED SETTINGS | |
|---|---|
| Setting Item | Function & Usage |
| Apply Recommended Settings | Crucial Switch. ON (Checked): The indicator ignores manual inputs and uses the internal logic optimized for the current pair. OFF: The indicator uses the manual values entered below. |
| 2. SESSION FILTER | |
| Setting Item | Function & Usage |
| Timezone | Sets the base time for the sessions below. Match this to your chart/broker time. |
| Session #1 – #4 | Defines the start and end times for specific markets (London, NY, Tokyo, etc.). Unchecking “Enable” will stop trading during that specific time slot. |
| 3. CORE SETTINGS (S#1 – S#4) | |
| Setting Item | Function & Usage |
| BB Period | The length of the Bollinger Band. Shorter periods react faster to sudden breakouts, while longer periods smooth out the noise. |
| Entry Sigma | The breakout threshold. Lower values allow for earlier entries (aggressive), while higher values wait for stronger confirmation (conservative). |
| 4. FILTERS & CONDITIONS | |
| Setting Item | Function & Usage |
| Expansion Th (pips) | Minimum band expansion required. Prevents trading during “squeezes” (flat markets) where trends are unlikely to develop. |
| Min Sep Bars | Cool-down period. Forces the system to wait a specific number of candles after a trade finishes before looking for a new signal. |
| Out-Walk Candles | Time Limit. If price doesn’t continue to “walk” the band for this set number of candles, the trade is closed early to free up capital. |
| Wick/Body Ratio | Anti-Fakeout Filter. Compares the wick length to the body length. It ignores candles with long wicks (rejections) to avoid false breakouts. |
| 5. RISK & SECURE LOGIC | |
| Setting Item | Function & Usage |
| Stop Loss (pips) | The fixed maximum loss allowed per trade. This value serves as the initial safety net before the trailing logic kicks in. |
| BE Activation MFE | “Trigger Point.” Defines how many pips the price must move in your favor to activate the Secure Mode. |
| BE Secure Offset | “Lock-in Point.” Once triggered, the Stop Loss is automatically moved to [Entry Price + This Value] to guarantee a profit. |
| Scramble Mode | Selects the trailing stop logic behavior (e.g., Aggressive mode for news spikes, or OFF for standard behavior). |
| 6. VISUALS & OTHERS | |
| Setting Item | Function & Usage |
| Price Source | Determines which price data (Close, High/Low) is used for calculations. “Close” is standard to filter intra-candle noise. |
| Show ENTRY/EXIT | Toggles the display of “LONG/SHORT” and “SECURE” labels on the chart. |
| Mushy Zone Opacity | Controls the visual darkness of the no-trade zone (gray area) between the bands. |
| Auto Spread | When checked, applies a pre-configured spread. Uncheck to manually input a fixed spread value. |
Chapter 5: Understanding “Secure Logic”
The defining feature of TENKYO is “Defensive Speed.”
The Problem with Standard Break-Even
Usually, traders move their Stop Loss to Break-Even (±0) after a certain profit. However, if this occurs frequently, it may lead to a sense of futility and increased stress.
The TENKYO Solution
TENKYO moves the stop to “Entry + Spread + Small Profit” immediately after the trend is confirmed. This converts what would be a “stressful scratch trade” into a “small win.”
Trade-off Warning: Because the stop follows closely, the occurrence rate of “Secure Exit” (micro-profit booking) is relatively high. You might miss some large trends that retrace deeply. This logic prioritizes stability of the equity curve over “hitting home runs.”
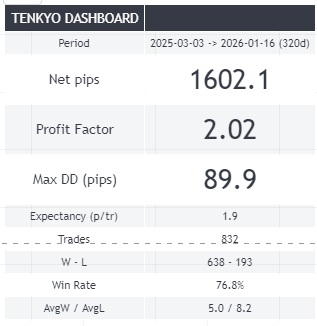
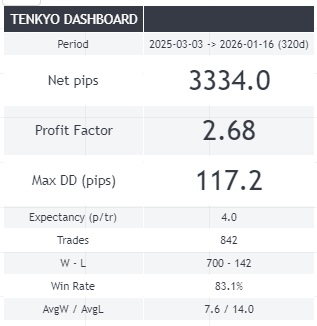
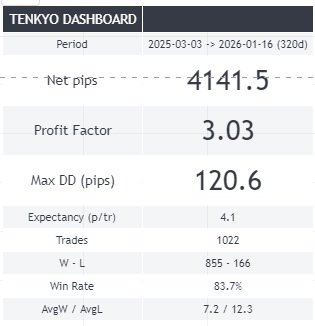
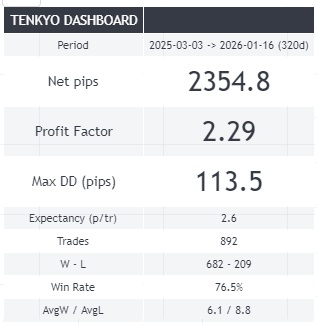
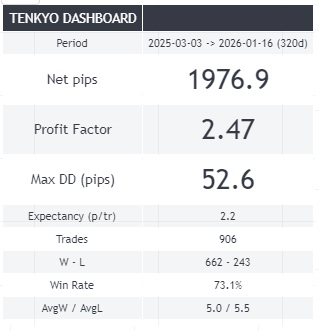
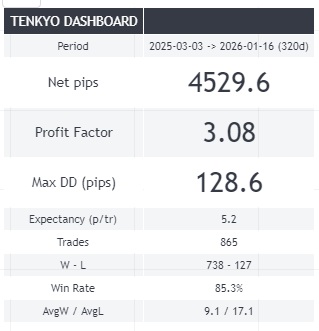
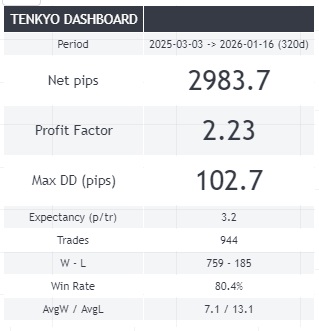
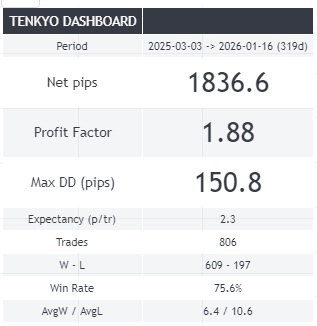
Chapter 6: Dashboard Metrics
What the numbers mean
- Net pips: Total profit, calculated by subtracting losses from the gains earned during the period.
- Profit Factor (PF): Gross Profit / Gross Loss. A value above 1.5 is generally considered healthy.
- Max Drawdown (DD): The maximum decline from a peak in equity. This is your “worst-case scenario” risk metric.
Disclaimer: Backtest results are historical data and do not guarantee future performance.
Chapter 6.5: Alert Configuration
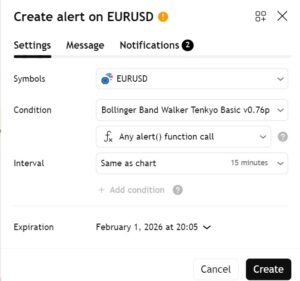
To trade effectively, you do not need to stare at the chart. Use Alerts.
- Click the ⏰ “Alert” icon.
- Select Bollinger Band Walker TENKYO as the condition.
- IMPORTANT: Select “alert() function calls”.
The indicator is programmed to send specific messages directly via this function.
The types of messages triggered are as follows:
| Message | Description |
| EXPANSION | The very early stage of band expansion. |
| LONG | Buy |
| SHORT | Sell |
| OutWalk | Exited due to trend end. Profit/Loss realized. |
| SECURE | Exited to lock in some profit before a potential reversal. |
| FAIL | Stop-loss triggered by acknowledging the entry was unsuccessful. |
| Stop Loss | Stop-loss triggered to prevent further loss. |
Chapter 7: Recommended 8 Currency Pairs Analysis
Why these 8 pairs? Because they exhibit the clearest “Expansion Velocity.” Here is how TENKYO behaves on each.
7-1 EURUSD (The Mathematical Edge)
Logic Fit: S-Rank.
Analysis: The world’s highest volume means the “Technical Noise” is lowest. While it lacks the explosive range of Cross-Yen, the ultra-low spread creates a mathematical advantage. The distance to the “Secure” profit lock is effectively shorter here, leading to a remarkably high Win Rate.
7-2 EURJPY (The Trend Driver)
Logic Fit: A-Rank.
Analysis: This pair balances “Power” and “Persistence.” Unlike USDJPY, it can produce massive 100+ pip runs in a single session. TENKYO often captures the biggest “Net Profit” here because the band walks tend to last longer, allowing the trailing logic to maximize gains beyond the initial Secure target.
7-3 USDJPY (The Benchmark)
Logic Fit: S-Rank.
Analysis: While the volatility is lower than GBP pairs, the “Cleanliness” of the breakout is superior. When USDJPY breaks the 2σ band, it rarely creates a “V-shape reversal” instantly. This gives the Secure Logic ample time to lock in profits. It is the most stress-free pair in the portfolio.
7-4 GBPUSD (The False-Break King)
Logic Fit: B-Rank (Requires Filter).
Analysis: “Cable” is famous for fakeouts (breaking the band and returning immediately). TENKYO battles this with the “Wick/Body Ratio Filter.” When configured correctly, it filters out the noise and catches the true London breakouts. Do not run this with default settings; ensure filters are ON.
7-5 USDCHF (The Hedge)
Logic Fit: C-Rank (Stability Role).
Analysis: It often moves inversely to EURUSD. We include it not for massive profits, but for portfolio balance. When other pairs are stuck in a range, USDCHF often produces slow, grinding trends that allow TENKYO to extract value from a quiet market.
7-6 GBPJPY (The Beast Tamer)
Logic Fit: Special.
Analysis: Usually considered high-risk due to its jagged movements (“The Dragon”). However, TENKYO turns this volatility into an advantage. Because the price jumps are so fast, the “Secure Trigger” is hit almost instantly after entry. It has a higher drawdown risk, but the recovery speed is unmatched.
7-7 CHFJPY (The One-Way Ticket)
Logic Fit: A-Rank.
Analysis: Forget the “Safe Haven” myth. In modern markets, CHFJPY is known for stubborn, unidirectional trends (often due to carry trade flows). Once it starts walking the band, it refuses to correct for hours. This behavior is ideal for TENKYO’s trend-following logic.
7-8 AUDJPY (The Session Specialist)
Logic Fit: B-Rank.
Analysis: Highly sensitive to equity markets (Nikkei/Dow) and resource prices. It shines specifically during the Tokyo Open (9:00 AM JST) and early London. Outside these times, it can be choppy. Use the “Time Filter” settings to maximize efficiency here.
Chapter 8: FAQs
Q: My profits per trade seem very small. Is this normal?
A: Yes, this is by design. The system is built to accumulate “Sure Wins” while waiting for a major trend. It prevents the psychological damage of seeing a profitable trade turn into a loss.
Q: Can I use it on mobile?
A: Yes, the TradingView mobile app supports this indicator fully. Alerts will also be pushed to your phone if configured.