
Table of Contents: Full Guide to the Implementation Process
- Chapter 1: Concept and Logic
- Chapter 2: Setup and Filling History Data
- Chapter 3: Obtaining the Latest Recommended Parameter Files
- Chapter 4: Signals and Interfac
- Chapter 5: Parameter Panel(Advanced)
- Chapter 6: Preference Panel
- Chapter 7: Notifications
- Chapter 8: Trade History Panel
- Chapter 9: Dashboard Interpretation and Real-time Tuning (Advanced)
- Bonus1: Receive [TENKYO System Trade EA]
- Bonus2: Receive [TradingView Version: Band Walk Alert TENKYO]
Chapter 1: Concept and Logic
We focus on the “initial price velocity” during the expansion of Bollinger Bands. We thoroughly eliminate gambling on predicting tops and bottoms, and detect as the “initial move” only the moment when momentum is statistically confirmed.
Through our unique Secure Logic, we prioritize “not losing” over “gambling for a fortune.” If it is determined that a trend will not develop, the system exits the market early to protect your capital until the next “big wave.” This is the true essence of TENKYO.
Chapter 2: Setup and Filling History Data
1. Installation Guide for MT4
1. Downloading the Produc
Click the product icon on the download page of the official website to download the compressed file in ZIP format.
*If the browser freezes or does not react: This site uses the ZIP format to avoid security protection issues. If there is no reaction when clicking, please try right-clicking and selecting “Save link as…”.
2. Extracting the File
Right-click the downloaded ZIP file and select “Extract All” or “Unzip”. Once extracted, you will find BandWalkAlertTENKYO_Pro.ex4 inside. This is the indicator file.
3.These are the steps to make MT4 recognize the downloaded file.
- Open the MT4 menu and click File > Open Data Folder.
- In the folder that opens, navigate through MQL4 > Experts.
- Right-click the downloadedBandWalkAlertTENKYO_Pro.ex file, select “Copy”, and then “Paste” it inside the “Experts” folder.
- Go to the Navigator panel on the left side of the MT4 screen (if it is not visible, press
Ctrl + N), right-click on Expert Advisors, and select Refresh. - Open the MT4 menu and click Tools > Options > Expert Advisors tab.
- Check “Allow WebRequest for listed URL” and add http://tenkyo-fx.com to the list.
- Double-click BandWalkAlertTENKYO_Pro in the Navigator list, or drag and drop it onto the chart you want to trade on.
- Copy all the included recommended parameter setting files into the MQL4 > Files folder.
2. Filling History Data (Crucial: Data Verification)
This is the task of correctly importing past price data into MT4, which serves as the basis for statistical calculations. If you skip this step, the values on the dashboard will be inaccurate.
- Open History Center: Press the F2 key on your keyboard.
- Follow the Currency Pair Hierarchy: Click the “+” mark to the left of the pair you want to use (e.g., Forex > USDJPY) to expand it.
- Select and Activate the Timeframe: Find “15 Minutes (M15)” in the list and look at the icon to its left. If the icon is gray, double-click on the text “15 Minutes (M15)”. Activation is successful when the icon changes to color (yellow and green).
- Download: Click the “Download” button at the bottom and proceed with “OK” even if a warning appears. Wait until the green bar reaches the right end.
- Restart MT4: After completion, close MT4 and launch it again.。
- Execute Forced Scroll: After restarting, click the Preference Tab at the top left of the chart and click [Fetch Past Bars] within the panel. The chart will automatically scroll back at high speed to supplement missing data. Wait until the screen stops.
Chapter 3: Obtaining the Latest Recommended Parameter Files
While recommended parameter files are included with your initial download, these settings are updated periodically to reflect current market conditions. Please follow the steps below to obtain the latest recommended parameter files.
Click “Check Recommended Parameter Files” from the Preference panel. The download panel will open.
Click [Download] on the panel to start the synchronization.
Alternative Method: You can also download them manually from the dedicated download site: https://tenkyo-fx.com/
Chapter 4: Signals and Interface
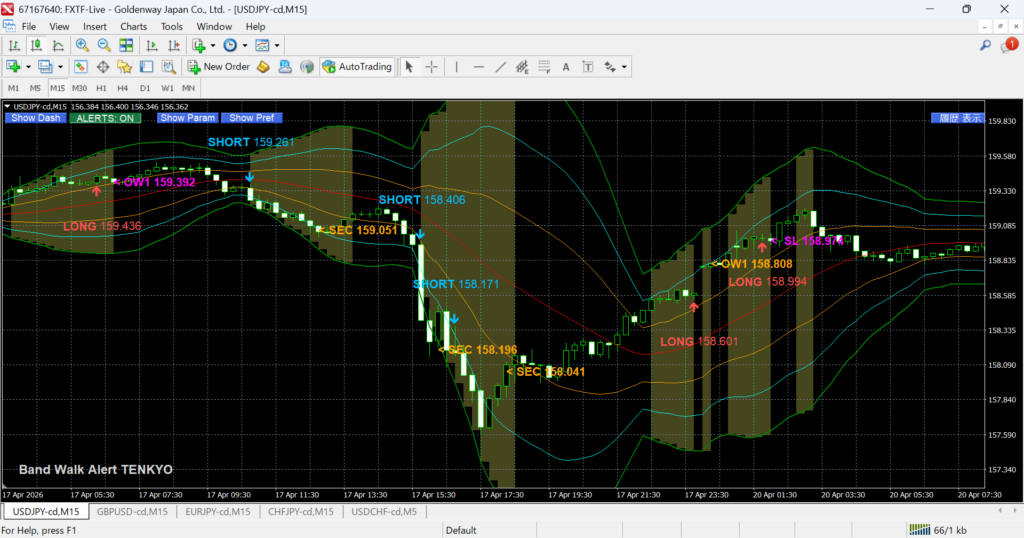
Each label lit on the chart is the result of calculating the correlation between the dynamic changes of Bollinger Bands and the candlesticks in milliseconds.
1. Entry Process (From Omen to Confirmation)
- EXPANSION (Omen): This lights up the moment the width of the 3rd standard deviation (±3σ) of the Bollinger Bands expands beyond the specified “Band Expansion Threshold (TH)” compared to the previous bar. This is a cautionary signal indicating that the “groundwork” for a statistical trend is ready.
- ENTRY (LONG / SHORT): After EXPANSION lights up, arrows and prices are displayed the moment all of the following conditions are cleared. If Scramble Mode (described later) is set to aggressive, an ENTRY signal may be issued suddenly without lighting EXPANSION.
2. Exit Logic (OW1–4: Four Definitions of Trend End)
TENKYO categorizes the grounds for judging that a “band walk has ended” into four types, maximizing profit while limiting risk.
- OW1 (Convergence): Exits the moment Bollinger Band expansion stops and the band width begins to contract (squeeze). This is the most standard exit indicating that trend momentum has died.
- OW2 (Counter-move): After entry, exits when candlesticks moving in the opposite direction (e.g., a bearish candle against a bullish move) appear consecutively for the specified “Allowable Counter-Bars.”
- OW3 (Deviation): Triggered when the price significantly breaks below/above the 2nd standard deviation (±2σ) and is judged to have deviated from the trend trajectory.
- OW4 (Center Line): Exits when the price returns to the center line (Basis) of the bands. This is the final line of defense when the trend has completely collapsed and is heading toward a range or reversal.
3.Special Exits and Defensive Signals
- SECURED (Small Profit Exit): After unrealized profit reaches the “Break-Even (BE)” line, if the price returns, the system takes profit at the Entry Price + Spread + specified pips (SEC). This is defensive logic designed to ensure zero losses.
- FAIL (False Breakout Avoidance): An emergency stop-loss signal to cut losses immediately while they are small, triggered if there is a high possibility the break was “false” (e.g., more than half of the candle body is pushed back within 1–2 bars after entry).
- Mushy Zone: An uncolored area on the chart. This is a stagnation zone with “zero edge” where bands are not expanding and the price is wandering near the center line. Within this area, all entry logic is automatically shut down.
Chapter 5: Parameter Panel(Advanced)
This chapter is for advanced users. If you find it confusing or troublesome, you may skip it. (Recommended parameters by the developer are pre-configured for major currency pairs.)
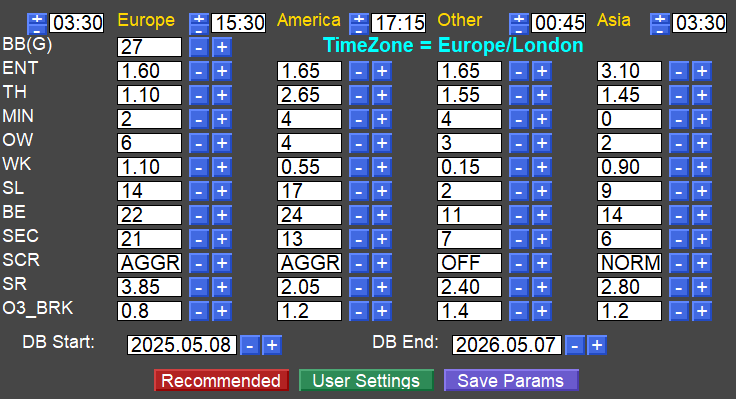
This is the heart of TENKYO, accessed by clicking the [Parameters] tab at the top of the chart. Here, you can fine-tune the system’s entry conditions and exit logic for four distinct time zones (sessions) with precision.
1. Session Structure
The parameters are divided into four sessions (S0 through S3). This allows the logic to adapt to the specific volatility and characteristics of different market hours (e.g., Tokyo, London, and New York sessions).
- Time Adjustment: Use the [ – ] [ + ] buttons (supports long-press) to slide the time forward or backward in 15-minute increments.
- Time Zone Synchronization: The time displayed here is automatically converted based on the “Display Time Zone” (e.g., Asia/Tokyo) configured in the PREF panel. There is no need to perform manual time-difference calculations in your head.。
2. Details of Each Logic Parameter (All 12 Items)
Adjust the numerical values in each session row to optimize the logic. The [ – ] and [ + ] buttons next to the values support long-press (rapid-fire) functionality. As you change these values at high speed, the dashboard performance metrics (such as PF and Win Rate) will be rewritten in real time.
- BB Period: The calculation period for the Bollinger Bands. Note: This item is applied globally across all sessions (adjustable only in the leftmost column).
- Entry Sensitivity: The sensitivity (deviation multiplier) for detecting breakouts from the bands.
- Band Expansion Speed: The threshold for determining the occurrence of the Onion Zone (Expansion).
- Minimum Interval: The minimum number of candlesticks that must pass after the previous exit before a new entry is permitted.
- Allowable Counter-Bars: Defines how many consecutive candles moving in the opposite direction (bearish vs. bullish) will trigger an “OW2 (Logical Exit)” to escape the trade.
- Wick Block: Specifies the ratio of the “wick length” relative to the candle body. It avoids entry by not recognizing price action as a breakout if it returns with a long wick.
- Stop Loss: The initial stop-loss width (pips) set immediately after entry.
- Break-Even: The moment unrealized profit reaches this many pips, the stop-loss is moved to the vicinity of the entry price (Small Profit Exit line).
- Secured Profit: Specifies how many “additional pips” to add to the entry price when a Break-Even exit is triggered to secure a small gain.
- Scramble Mode: Entry restrictions against violent movements during the early stages of band expansion. Choose from Aggressive (AGGR), Normal (NORM), or Off (OFF). Note that being too aggressive increases the risk of getting caught in false breakouts.
- Surge Block: A filter multiplier to prevent “buying the top” or “selling the bottom” when an abnormally large candlestick (sudden surge or crash) appears.
- OW3 Break: Specifies which position on the band the counter-bar must break for the system to judge the trend has ended.
3. Specifying the Backtest Aggregation Period
At the top of the lower section of the panel, there is an item to specify the “Period” for aggregating the performance metrics (such as total trades and Profit Factor) displayed on the dashboard.
- Start Period: The date to begin aggregation.
- End Period: The date to end aggregation.
- Setting Method: Directly rewrite the text within the white boxes, or use the [ – ] [ + ] buttons on the side to increase or decrease the date by one day at a time.
Parameter Management and Preservation (Action Buttons)
At the bottom of the [Parameters] tab, you will find the buttons used to manage the numerical data you have adjusted.
- Recommended Settings: Downloads and applies the latest “Recommended Parameter File” from the official server. While active, the button turns bright red (glowing).
- User Settings: Recalls your previously saved “Custom Parameter File.” While active, the button turns bright green.
- Save Parameters: Writes all values currently displayed on the panel (time zones, the 11 parameter items, and aggregation period) to a local file as your dedicated User Settings. Always save after finishing your adjustments.
Chapter 6: Preference Panel
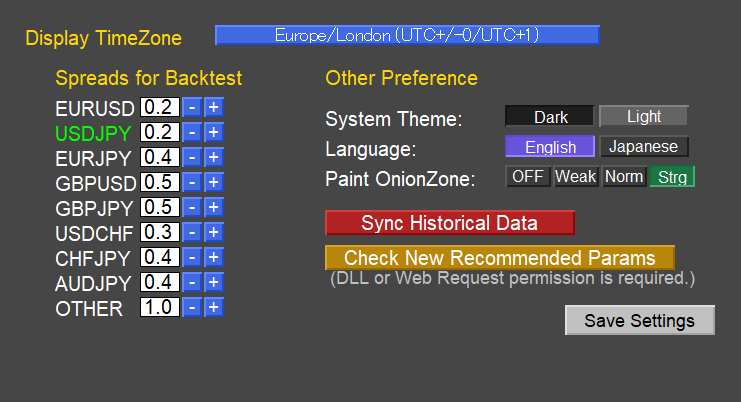
This is an explanation of the panel that expands when you click the [PREF] (Preferences) toggle button at the top of the chart. This dedicated section is used to customize the display settings and the environmental premises for calculations.
1. Display Time Zone
This setting allows you to align the chart’s time axis with your preferred region for better visibility.
- Setting Method: Click the blue button displaying the current time zone name (e.g., Asia/Tokyo) to show a dropdown list of 20 global regions.
- Role: Selecting this ensures that internal session times (identifying European, North American, Asian sessions, etc.) are correctly synchronized.
2. Spread Used for Backtesting
This setting defines the transaction cost (spread) used to calculate the performance metrics on the dashboard.
- Individual Input: You can set the spread (in pips) individually for the eight major (recommended) currency pairs, such as EURUSD and USDJPY, as well as for “OTHER” pairs.
- Setting Method: Directly type the value into the white input box, or use the [ – ] [ + ] buttons (supports long-press) for fine adjustments. The currency pair of the currently active chart will be highlighted in Lime.
3. Other Customizations
This is the UI settings area for switching the system’s appearance and language.
- Background Color: [Dark Background] / [Light Background] Optimizes the color palette of the panels and signals (arrows and text) to match your chart’s background.
- Language: [English] / [Japanese] Instantly toggles all text within the panels and notifications (alerts) between the two languages.
- Onion Zone Fill: [OFF] / [Faint] / [Light] / [Dense] Selects whether to highlight the background of the high-probability “Onion Zone” (band expansion period) with color on the chart.
4. External Communication and Data Management (Action Buttons)
These buttons handle the exchange and preservation of external data.
- Retrieve Past Bars: Clicking this opens a dedicated download dialog (bar count selection screen). It forces the loading of missing historical data to ensure accurate calculation of past performance.
- Check Recommended Parameter File: Accesses the official server to check for the latest optimization files. From here, you can transition to the “Recommended Parameter Acquisition Panel (Selection screen for Methods 1–3)” and download the latest settings. *Execution requires MT4 DLL permissions or WebRequest permissions. To use WebRequest, please set up the separate TENKYO WebRequest EA (Free).
- Save Settings: Writes the spreads, themes, language settings, and other changes made within the panel to a local file.
Chapter 7: Notifications
Entries and exit signals appearing on the Bandwalk Alert TENKYO screen can be sent as notifications to your smartphone.
Preparation on the Smartphone Side (Checking MetaQuotes ID)
To send push notifications, you must identify your MetaQuotes ID, which acts as the “address” for the alerts.
- Launch the mobile MT4 app on your smartphone.
- Open the Settings menu:
iPhone: Tap “Settings” in the bottom right corner.
Android: Select “Settings” from the three-line menu in the top left corner. - Tap “Chat and Messages” (or simply “Messages”).
- At the bottom of the screen, you will see “My MetaQuotes ID: [8-digit alphanumeric code]”. Please write this down or copy it.
Note: This ID may change if you reinstall the app. If you stop receiving notifications, please re-check this ID.
Settings on PC MT4 (Enabling Notifications)
Configure the “Send/Receive” settings on your PC version of MT4 to push notifications to your smartphone.
- Open the Options Window: In the top menu of PC MT4, click [Tools] → [Options] (Shortcut:
Ctrl + O). - Select the Notifications Tab: Click on the [Notifications] tab.
- Enable the Feature: Check the box for [Enable Push Notifications].
- Enter Your ID: In the “MetaQuotes ID” field, enter the 8-digit alphanumeric code you previously noted from your smartphone app.
- Test the Connection: Click the [Test] button. If you receive a notification on your smartphone saying “Test message from [Your PC Name],” the setup is complete.
- Confirm Settings: Finally, click [OK] to close the window.
Important: Your PC MT4 must remain running to send notifications while trading. Notifications will not be delivered if the PC is turned off or in sleep mode.
Types of Events That Trigger Notifications
- Expansion/No Entry: Sends a notification for “precursor” signs when band expansion is detected, or when a trade is bypassed because conditions were not met.
- Entry (LONG/SHORT): Notifies you the exact moment an entry arrow lights up once statistical edge is confirmed.
- Exit: Notifies you the instant a trade is closed (via OW, SL, SEC, FAIL, etc.).
Chapter 8: Trade History Panel
This is an explanation of the panel that expands when you click the [History] toggle button at the top right of the chart. It is a powerful analytical tool that lists the entire history of virtual trades executed within the specified backtest period, allowing you to verify in detail exactly “at which point and for what reason” each trade was closed based on your parameter settings.
1.How to Read the Trade History List
The panel displays up to 60 rows of historical data per page, arranged in reverse chronological order (starting from the most recent) using a fixed-width font. Text is color-coded so you can distinguish between winning and losing trades at a glance.
- TIME: The date and time when the trade was closed.
- TYPE: Indicates LONG (Buy) or SHORT (Sell).
- ENTRY / EXIT: The price at which the trade was opened and the price at which it was closed.
- PIPS: The profit or loss for that trade, expressed in pips.
- REASON: The logical basis for ending the trade:
- SEC: Secured profit (securing gains after moving the stop-loss to breakeven).
- SL / TSL: Initial Stop Loss or a “Temporary Stop Loss” triggered during market scrambles.
- OW1–OW4: Logical exits based on the determination that the trend has ended.
- FAL (FAIL): Avoidance exit triggered by false breakouts (wicks) or sudden price reversals.
2. Scrolling and List Navigation
If the trade history exceeds 60 entries, four blue sub-buttons will automatically appear at the top of the panel, allowing you to trace back and verify past data.
- [ – ] Button: Scrolls the list toward older history (the past). Clicking the button and releasing it initiates continuous scrolling. Click it again to stop.
- [ + ] Button: Scrolls the list toward newer history (the future). Click it again to stop.
- [ Jump to Latest (TOF) ] Button: No matter how far back you have scrolled, this button returns the list to the very top (the most recent trade history) with a single click.
3. Performance Report CSV Export
This feature allows you to export the analyzed trade history to an external file for more advanced analysis or record-keeping.
- Export Button: Clicking the [Export] button (or similar CSV icon) in the panel generates a CSV file containing all the data from the current trade history list.
- File Location: The file is typically saved in the
MQL4\Filesfolder of your MT4 Data Folder. - Data Usage: You can open this file in Excel, Google Sheets, or other spreadsheet software to calculate your own custom metrics, create performance graphs, or maintain a long-term trading journal.
- Comprehensive Data: The export includes all key details for each trade, such as Entry/Exit times, Prices, Pips, and the specific logical Reason for each settlement, making it easy to filter and sort your results.
Chapter 9: Dashboard Interpretation and Real-time Tuning (Advanced)
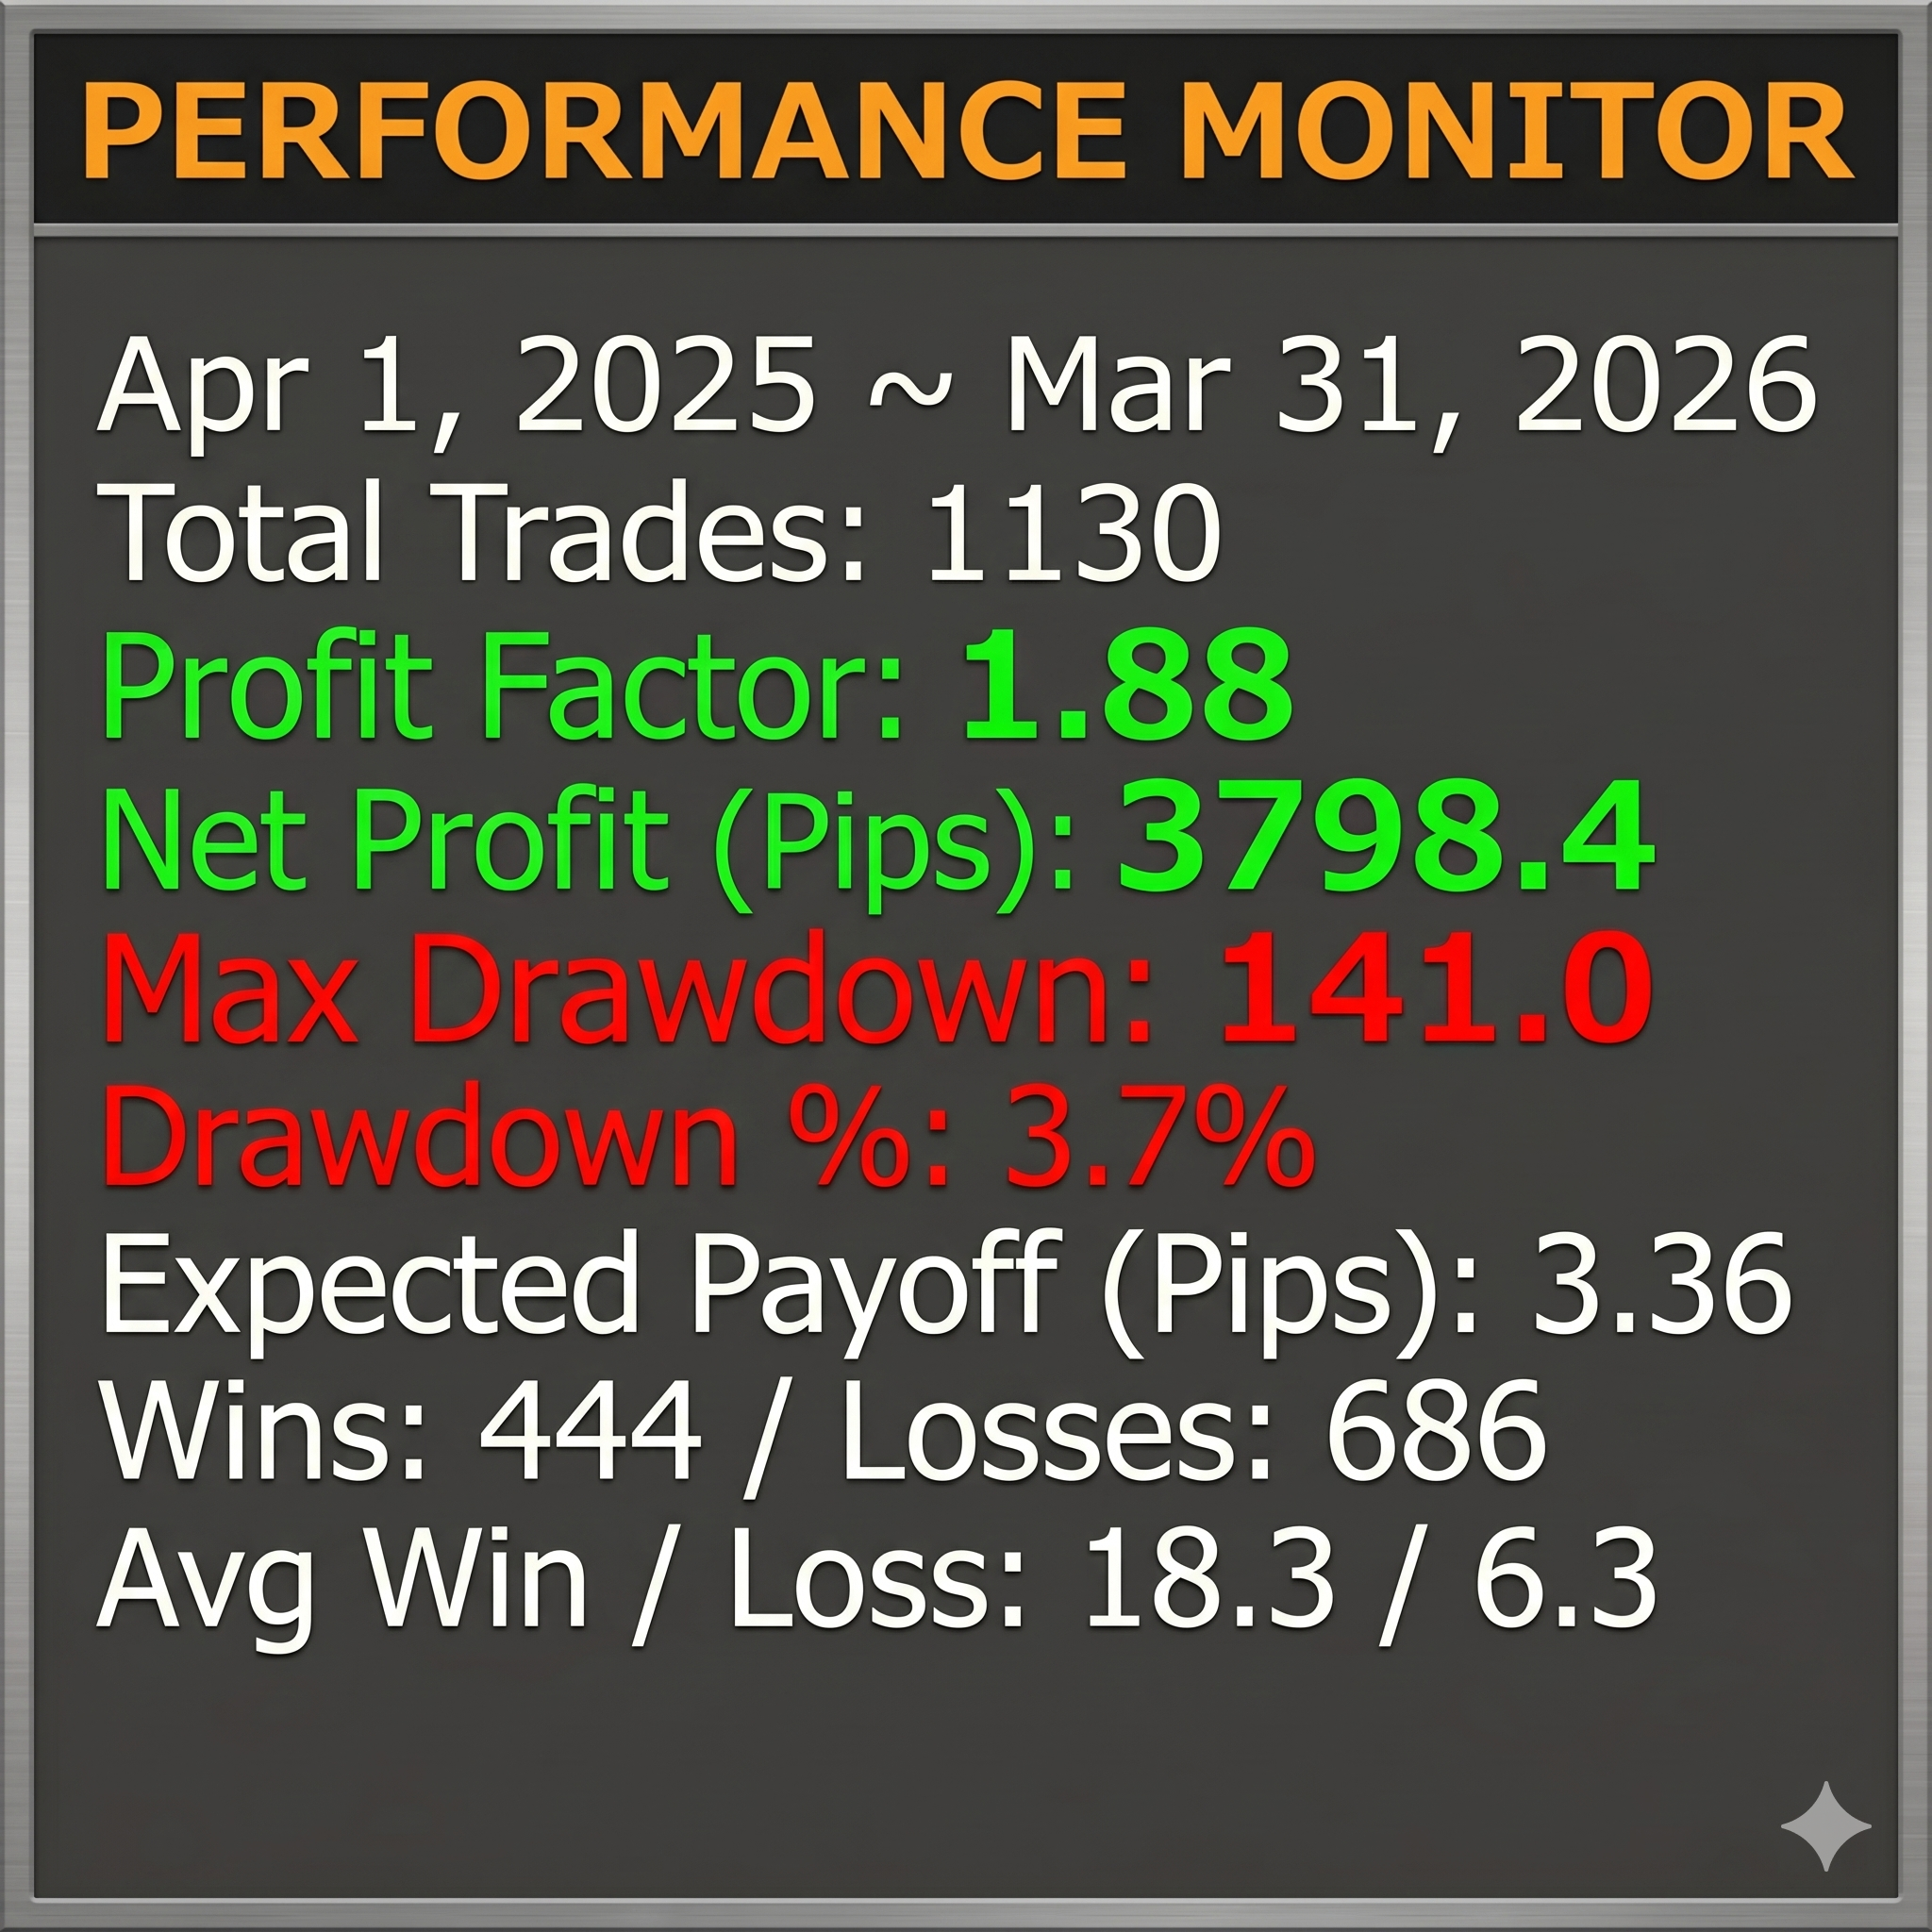
This is an explanation of the statistical dashboard displayed at the top left of the chart. It is the most important monitor for objectively evaluating the effectiveness of your settings, as it calculates the “total performance of virtual trades” in real-time based on the aggregation period specified in the parameter panel.
1. Display and Functional Control via Toggle Buttons
You can control the dashboard’s visibility and specific features using the toggle buttons located at the top of the interface.
- [Show/Hide Dash] Button: Toggles the visibility of the dashboard panel itself. You can hide it if it obstructs your chart analysis.
- [Notifications: ON/OFF] Button: Acts as the “master switch” for all alerts sent by the system.
2. Complete Explanation of Performance Indicators
The dashboard displays nine types of statistical data based on the trade results within the aggregation period (shown in silver directly below the title). Key indicators are highlighted in specific colors for quick identification.
- Total Count: The total number of trades executed within the specified period. For statistical reliability, please use these figures as a reference only when the sample size is at least 100 trades.
- Profit Factor (PF): Calculated as “Total Gross Profit / Total Gross Loss,” this is the cornerstone of system evaluation. A value of 1.0 is the break-even point. A PF of 1.5 or higher indicates a highly competitive and excellent logic. This metric is not reliable with low trade counts; it requires at least 100 trades to be statistically significant.
- Net Profit (Pips): The final net profit after subtracting all loss pips from profit pips. This is a highly realistic figure as it pre-deducts the “Spread” value entered in the environment settings panel.
- Max Drawdown: The “deepest valley” in pips, representing the largest decline from a previous peak in the equity curve. A smaller value indicates a more stable and consistent upward trajectory.
- Drawdown Ratio: The percentage (%) of the maximum drawdown relative to the total net profit. (Max Drawdown / Net Profit times 100)
- Expected Payoff (Pips): The expected value representing the average profit (or loss) anticipated per trade. (Net Profit / Total Count)
- Wins / Losses: The breakdown of the number of trades that ended in a profit versus those that ended in a loss.
- Average Win / Loss: Displays the average pips gained per winning trade alongside the average pips lost per losing trade. This allows you to verify the balance of your “Risk/Reward” ratio.
This is a special offer commemorating the release of the MT4 Band Walk Alert TENKYO, limited to the first 100 customers.
This offer will expire as soon as the 100th spot is filled.
Bonus1: Receive [Band Walk Alert TENKYO System Trade EA]
We are offering the Band Walk Alert TENKYO System Trade EA” for free as a special bonus, allowing you to automate trading directly from the indicator’s signals. Once the limit of 100 users is reached, it will become a paid product.
However, when using automated trading tools, you must understand and accept all the following risks at your own discretion. By using this tool, the user is deemed to have agreed to these terms:
By operating this EA, the user is deemed to have fully understood and agreed to the following terms:
- Operational Uncertainty: This EA may experience unexpected behavior, such as “failing to enter trades as intended,” “failing to close positions at the correct timing,” or “leaving positions abandoned” due to market conditions, network environments, MT4 platform specification changes, or VPS malfunctions. These occurrences are considered inherent program specifications or acts of God. The author assumes no obligation to provide fixes or compensation for any resulting damages, including lost opportunities, unrealized losses, or forced liquidations.
- Bugs and Defects: As with any software, there is a possibility of latent bugs or design flaws. Users must operate the EA with the full understanding of the “risk of incurring losses due to bugs.” The provision of bug fixes or updates is at the sole discretion of the author, and there is no guarantee of an immediate response to user requests.
- Full Responsibility for Losses: Any and all losses incurred through the use of this EA are 100% the responsibility of the user. The author will not be involved in any capacity, “under any circumstances, for any reason whatsoever.” Regardless of the scale of damage or the cause of occurrence, users are strictly prohibited from making any claims for damages, refund requests, or complaints against the author, including moral responsibility.
- Absolute Self-Management: The determination of lot settings, risk management, and the decision to continue or stop operations is entirely the user’s obligation. Users must acknowledge that all outcomes resulting from leaving the EA running are the direct consequence of their own choices.
The claim that “I lost because the tool didn’t work as expected” is not valid in the world of investing. If you are dissatisfied with any part of these terms—even in the slightest—you are prohibited from using this EA.
Bonus2:Receive[TradingView Version: Band Walk Alert TENKYO]
We are providing a special invitation to access the “TradingView Version: Band Walk Alert TENKYO” (regular price 300 USD + tax) for free. This version has been meticulously engineered to replicate the original MT4 logic with extreme precision on the TradingView platform.
Once the limit of 100 users is reached, it will transition to a paid service.
This allows you to monitor the Ten-Kyo signals and “Onion Zones” from anywhere using your smartphone or tablet while on the go.
1. Prerequisites for Receiving the Bonus
The TradingView version is an “Invite-only script” that is not available to the general public. To receive access, you must create a TradingView account (either Free or Paid) and know your unique “Username.”
2. Three Steps to Claim Your Bonus
- Prepare Your IDs: Have your purchase order number (provided at the time of the MT4 version purchase) and your TradingView Username ready.
- Send your application message to the official reception for the TV version bonus.
tvver-apply@tenkyo-fx.com- Keyword: “Request TV Version Bonus”
- SerialCode for MT4 version
- Your TradingView Username
- Wait for the Invitation/Access Notification: The administration team will process the access permissions in the order they are received. Once completed, you will receive an “Access Granted” email from the official support team.
3. How to Display on TradingView
Once your access has been granted, follow these steps to add the script to your chart.
- Open the Indicators Menu: Click on the “Indicators” button (or press
/) at the top of your TradingView chart screen. - Locate Invite-only Scripts: Select the “Invite-only scripts” category from the sidebar on the left side of the library window.
- Add to Chart: Find “Band Walk Alert TENKYO” in the list and click it. The logic, including the signals and Onion Zones, will immediately appear on your active chart.
- Sync Settings: To ensure the display matches your MT4 environment, open the script settings (gear icon) and input the same parameter values you use in the MT4 version.
Note: If the script does not appear in the “Invite-only” section immediately after receiving the completion email, please refresh your browser or log out and log back into TradingView to sync your account permissions.
[Operational Advice] By performing meticulous parameter adjustments on your home MT4 setup and copying those “Golden Values” into your TradingView parameter settings, you can receive signals with the exact same precision as your home environment even while on the go.
Please note that this software does not perfectly match the behavior of the MT4 version with 100% consistency. Please be aware of this before use.
Disclaimer
[Important] Terms and Notes Regarding the Software and Manual
Before using this software, “[Insert Indicator Name Here],” as well as the accompanying manuals, bonuses, and related information (hereinafter referred to as “the Content”), please read the following disclaimer carefully and agree to these terms.
- Acknowledgment of Investment Risks Financial product trading, such as Foreign Exchange margin trading (FX), stock index futures trading, and cryptocurrency trading, involves significant risk. Neither principal nor profits are guaranteed. Due to market fluctuations, interest rate changes, and other factors, there is a risk of losing more than your initial investment capital.
- Nature of the Information The Content presents proprietary analysis methods and tools based on the author’s personal experience and historical market data. It does not guarantee future profits, nor does it recommend or solicit specific trades. The Content does not constitute “investment advice” and is provided solely for educational and informational purposes.
- Limitation of Liability The author and seller shall not be held liable for any direct, indirect, incidental, or consequential losses, damages, or troubles incurred by the customer resulting from the use of the Content or this software. All actual trading must be conducted based on the customer’s own capital management and sole responsibility for making final investment decisions.
- Operating Environment and Technical Issues While this software has been tested and verified to operate on specific platforms (such as MT4 / MT5), we do not guarantee its operation in all PC environments, nor do we guarantee the accuracy or completeness of the delivered data. We assume no responsibility for malfunctions or discrepancies in rendering caused by specification changes on the platform side, server downtime, or sudden market shifts (such as spread widening or slippage).
- Copyright and Prohibited Actions All copyrights to the Content belong exclusively to the author. For any reason whatsoever, unauthorized reproduction, copying, distribution, resale, lending to third parties, or analysis of the source code (including reverse engineering) of this software and manual is strictly prohibited. Legal action may be taken if any such violations are discovered.